
Candlestick Patterns Explained with Examples
📈 Learn key candlestick patterns with real examples to read price movements effectively. Improve your trading decisions using this practical guide designed for Indian traders.
Edited By
Daniel Hughes
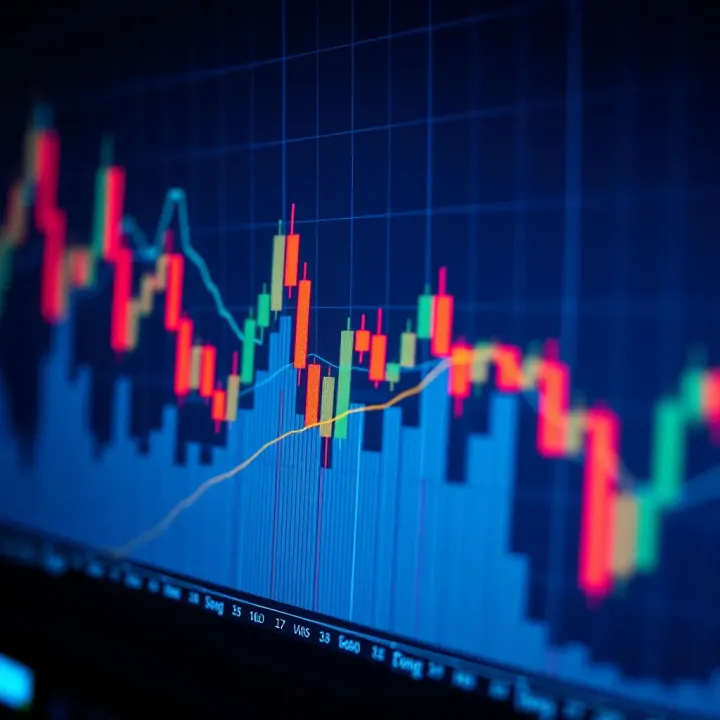
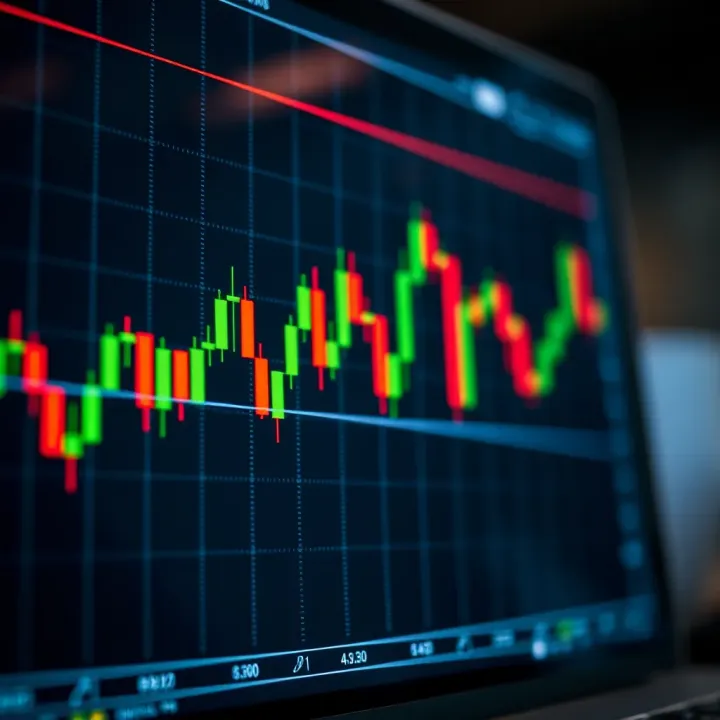
Candlestick chart patterns give a clear visual snapshot of price action over specific periods. They track the opening, closing, high, and low prices of assets like stocks, currencies, or commodities. This helps traders quickly gauge market sentiment—whether bulls or bears are in control.
Each candlestick consists of a body (the range between open and close) and wicks (shadows) extending above and below. A filled or colored body often means the price closed lower than it opened (bearish), while a hollow or light-colored body shows a higher close (bullish).

Patterns formed by one or multiple candlesticks can hint at potential trend reversals or continuations. For example:
Bullish Engulfing Pattern: A small red candle followed by a larger green candle that 'engulfs' it. It signals a possible upward shift.
Bearish Harami: A big green candle followed by a smaller red candle within its range, suggesting weakening bullish momentum.
Traders use these signals to time entries and exits. But no pattern guarantees a move—context like trend direction, volume, and support/resistance levels improves accuracy.
Paying attention to volume alongside candlestick patterns makes a big difference. Higher-than-average volume during a bullish pattern often confirms stronger buying interest. Conversely, low volume on a reversal pattern may mean it's less reliable.
Also, spotting these patterns during an existing trend helps:
A bullish pattern in a downtrend can signal a potential reversal.
A bearish pattern in an uptrend might point to a pullback.
Quick Tip: Always view candlestick patterns in context. Don’t trade a pattern alone. Check volume trends, nearby support or resistance, and overall market conditions.
Understanding candlestick charts takes practice, but once you get the hang of spotting key formations like dojis, hammers, engulfing candles, and shooting stars, you’ll have a valuable tool for reading markets more clearly and making smarter trades.
Candlestick charts play a fundamental role for traders looking to understand price movements at a glance. Unlike simple line charts that only track closing prices, candlesticks reveal the open, high, low, and close for each time period — details that provide richer insight into market sentiment and momentum. By grasping the basics, investors can quickly spot potential reversals, continuation patterns, or volatile price swings.
Open, High, Low, Close Explained
Each candlestick represents a period such as a day, hour, or minute. The open is the price at which the asset started trading during that period, and the close is where it ended. The high and low mark the maximum and minimum prices reached. For example, if a day's trading for a stock starts at $50, hits a high of $55, dips to a low of $48, and closes at $53, all these values get captured in one candle. Knowing these figures helps identify not just price levels but also volatility.
Body, Wick, and Shadow
The body shows the difference between open and close. When the close exceeds the open, the body is typically green (bullish); when it’s lower, it’s red (bearish). The wick or shadow extends above and below the body, showing highs and lows beyond the open and close. Long wicks can signal rejection of higher or lower prices — like during a sharp intraday change. Traders often watch these elements to judge buying or selling pressure beyond the surface-level move.
How Candles Reflect Market Sentiment
Each candle tells a story about supply and demand. A big green candle with a small wick suggests strong buying interest pushing prices up. On the other hand, a small body with long wicks might reflect indecision — buyers and sellers fought it out, but neither dominated. This subtlety offers clues about whether momentum will continue or if a shift might happen soon.
Bullish vs. Bearish Candles
Bullish candles close higher than they open, often shown in green, indicating buying strength. Bearish candles close lower, shown in red, signaling selling pressure. Recognizing the pattern of these candles helps traders understand if bulls or bears are winning in the short term, which can guide entry or exit decisions.
Doji and Spinning Tops
Doji candles have nearly equal open and close prices, resulting in a very small body, often resembling a cross or plus sign. They signify indecision and possible turning points, especially after a strong trend. Spinning tops have small bodies with longer wicks on both sides, showing a balance of power but more uncertainty. Spotting these helps caution traders about potential reversals or sideways price action.
Marubozu Candles
Marubozu are bold candles that lack wicks, meaning the open or close is also the extreme price of the period. A bullish marubozu opens at the low and closes at the high, suggesting uninterrupted buying momentum, while a bearish one does the opposite. These candles indicate strong commitment by traders and can foreshadow significant price moves.
Understanding the nuances of candlestick basics strengthens your ability to read market signals with precision, making it easier to choose smarter trades and better manage risk.
Bullish candlestick patterns are essential tools for traders aiming to identify potential upswings in the market. These patterns signal that buyers might be gaining control, which could lead to price increases. Spotting these early can help traders time their entries better and manage risk more effectively.
A hammer appears after a downtrend and features a small body near the top of the candle with a long lower wick. This shape suggests that sellers pushed prices lower but buyers fought back by the close. The inverted hammer is similar but has a long upper wick instead, showing that buyers tried to push the price up but sellers pushed it back down. Both require confirmation from the next candles to be reliable.

These candles hint at a potential market turnaround. For example, after a decline, seeing a hammer may indicate buyers are stepping in, making it a warning to watch for a reversal. The inverted hammer signals hesitation—buyers' attempt to lift prices wasn't sustained, but it still flags possible strength. Traders often look for a green candle following a hammer or inverted hammer to confirm the shift.
A bullish engulfing pattern forms when a small red (down) candle is followed by a larger green (up) candle that completely covers the previous candle’s body. This shows a sudden surge of buying interest that overwhelms sellers. It often appears after a downtrend, signaling a shift in momentum.
This pattern serves as a strong clue that the momentum has turned in favor of buyers. For instance, if a stock has been falling and then displays a bullish engulfing, traders might consider this a cue to enter long positions. It's not a guarantee but a practical signal to observe volume and other indicators for confirmation.
The morning star is a three-candle pattern that signals a bullish reversal. It starts with a long red candle showing continued selling, followed by a small-bodied candle (can be red or green) indicating indecision, then a long green candle that closes well into the first candle’s body. This sequence shows sellers losing steam and buyers returning.
Traders often use the morning star as a cue to begin buying once the third candle confirms upward momentum. For example, entering at the close of the third candle or on a slight retracement afterward can be effective. Placing stop losses just below the low of the middle candle helps manage potential risk.
Understanding these bullish candlestick patterns equips traders to spot turning points and better time their trades, improving chances of capitalizing on upward moves while controlling downside.
Bearish candlestick patterns are key tools for traders and investors aiming to identify potential price drops. These patterns signal when sellers are gaining control, indicating possible reversals or downtrends. Recognizing these patterns early can help you manage risk by timing your exits or short positions better.
The shooting star appears after an uptrend, showing that despite a strong price push, sellers took over by the close. It has a small real body near the low of the day, a long upper wick at least twice the body, and little to no lower wick. This shape suggests buyers tried to push prices higher but met resistance, signaling fading bullish enthusiasm.
A practical example: if a stock jumps to $50 during the day but closes at $46 with a tiny body near $46 and a long shadow reaching $50+, it’s likely a shooting star. This pattern warns that the stamina to push prices up weakens, which may lead to a reversal.
For sellers, spotting a shooting star is a sign to watch closely. It’s not a guaranteed sell signal by itself, but when coupled with high volume, it often signals that selling pressure is building. This might prompt you to tighten your stop losses or consider short-selling if other indicators confirm the bearish outlook.
However, beware of false signals especially in volatile markets. Confirming this pattern with trend analysis or volume helps avoid premature decisions. Also, look out for the next day’s candlestick – if the following candle closes below the shooting star’s body, the reversal is more reliable.
A bearish engulfing pattern covers two candles where the second candle’s body completely swallows the previous bullish candle’s body. This shift from a green (bullish) candle to a larger red (bearish) candle highlights a sudden momentum shift from buyers to sellers.
For instance, a stock moving from a small green candle showing slight gains to a larger red candle that opens above and closes below the prior candle’s range demonstrates a strong sell-off. This signals that sellers are overpowering buyers rapidly.
Bearish engulfing patterns often mark the start of a downturn, especially when they appear at resistance levels or after a strong upward move. Traders might use this pattern to anticipate a price drop and adjust positions accordingly.
Still, it’s smart to combine this with other signals like volume spikes or moving average crosses for better reliability. An engulfing pattern during low volume may not lead to sustained declines, so context is key.
The evening star is a three-candle formation signaling a top or reversal after an uptrend. It starts with a tall bullish candle, followed by a small-bodied candle (could be bullish or bearish) that gaps above the first candle’s close. The third candle is a strong bearish candle closing deep into the first candle’s body.
This sequence tells a story: buyers’ strength wanes, indecision hits, then sellers sweep in. It’s a clear warning sign of a change in market sentiment from bullish to bearish.
Traders often use the evening star as a cue to sell or short. Placing stop losses just above the second candle helps manage risk if the pattern fails. It’s also common to look for confirmation from volume spikes or other technical tools like RSI showing overbought conditions.
Because it involves three candles, you have a bit more time to react compared to single-candle patterns. That said, quickly responding to this signal can protect gains or limit losses when the market shifts downward.
Bearish candlestick patterns don’t guarantee price drops but serve as valuable signals. Combining them with trend and volume analysis strengthens trade decisions and helps manage potential risks effectively.
Candlestick patterns tell a story about price action, but without confirmation, they can sometimes lead you astray. That’s where volume and trend analysis come in—they provide extra clues that help separate genuine signals from noise. By combining these elements, traders can get a clearer picture of market intentions and make smarter decisions.
A surge in trading volume during the formation of a candlestick pattern often signals strong market interest, making the pattern more trustworthy. For example, if a bullish engulfing pattern appears with a noticeable volume spike, it suggests that buyers are stepping in forcefully, reinforcing the likelihood of a price reversal. On the flip side, a pattern forming on low volume might mean fewer participants are involved, which weakens its predictive power.
When volume dwindles during a pattern’s formation, it can be a red flag for false signals. Say you spot a hammer candle indicating a potential reversal, but volume is barely above average or declining. This low participation often means the market lacks conviction, increasing the chance the reversal won’t hold. Traders should watch out for such volume drops and avoid acting solely on candle shapes without volume support.
Candlestick patterns near significant support or resistance levels carry more weight. A shooting star forming right at a strong resistance zone, for instance, looks a lot more convincing than one in the middle of a range. Those price levels act like psychological barriers; if a bearish pattern forms there with confirming volume, it’s often a solid signal that sellers could be taking control.
Moving averages help smooth out price fluctuations and reveal underlying trends. When a bullish candle pattern emerges close to a rising 50-day moving average, it may signal a continuation of the uptrend. Conversely, if a bearish engulfing pattern happens just as the price crosses below the 200-day moving average, it reinforces bearish momentum. Using these averages adds a layer of confirmation, helping traders avoid jumping on weak or premature signals.
Bottom line: Candlestick signals gain real power when confirmed by volume and trend indicators. Without this, patterns can easily mislead, costing you time and money in the markets.
Candlestick patterns are valuable tools that help traders identify potential turning points in the market. But their real power lies in how you apply them within trading strategies. Using these patterns correctly can give you clearer entry and exit points, helping to improve both timing and risk management.
Using Patterns to Time Trades: Recognizing specific candlestick formations can signal when to jump in or get out of a trade. For example, a bullish engulfing pattern after a downtrend might suggest buyers stepping in, offering a good entry point. Conversely, spotting a shooting star near a resistance level could warn of a price drop, pointing to an exit opportunity or short sell. Timing trades around these signals can mean the difference between catching a move early and chasing the price later.
Setting Stops and Targets: Once you’ve identified an entry point using a candlestick pattern, setting stop-loss levels and profit targets becomes essential. For instance, after entering on a hammer pattern signaling a reversal, you might place a stop just below the candle’s low to limit losses. Targets can be based on previous support or resistance areas, or calculated risk-reward ratios like 2:1. This structured approach helps lock in gains while managing downside risk.
False Signals and Market Noise: Candlestick patterns aren't foolproof. Especially in choppy markets, patterns can produce false signals, leading to premature entries or exits. A doji candle might appear to signal indecision or reversal, but if volume is low or the overall trend is strong, price might continue its original direction. Relying solely on candlesticks without context can cause costly mistakes.
Never treat candlestick patterns as standalone trading commands—they provide clues, not certainties.
Importance of Using Multiple Indicators: To improve reliability, traders often combine candlestick patterns with other technical tools. For example, confirming a bullish engulfing pattern with rising volume or a moving average crossover strengthens the case for a trade. Support and resistance levels can also filter out weak signals. Using a blend of indicators offers a more complete picture and reduces the chance of falling for false moves.
By carefully applying candlestick patterns with clear entry and exit guidelines—as well as acknowledging their limits—you can make smarter trading decisions that better fit your risk tolerance and style.
📈 Learn key candlestick patterns with real examples to read price movements effectively. Improve your trading decisions using this practical guide designed for Indian traders.
📈 Learn how to read market candlestick patterns for better trading decisions in the Indian financial markets. Get clear insights and practical tips for success!

📊 Master key candlestick patterns for intraday trading to spot bullish and bearish signals fast. Learn interpretation, application strategies & risk management tips.

📈 Learn to spot key candlestick chart patterns for smarter stock market moves. Download PDF resources for detailed insight and boost your trading skills in India.
Based on 6 reviews