
Candlestick Patterns Explained with Examples
📈 Learn key candlestick patterns with real examples to read price movements effectively. Improve your trading decisions using this practical guide designed for Indian traders.
Edited By
Henry Fletcher
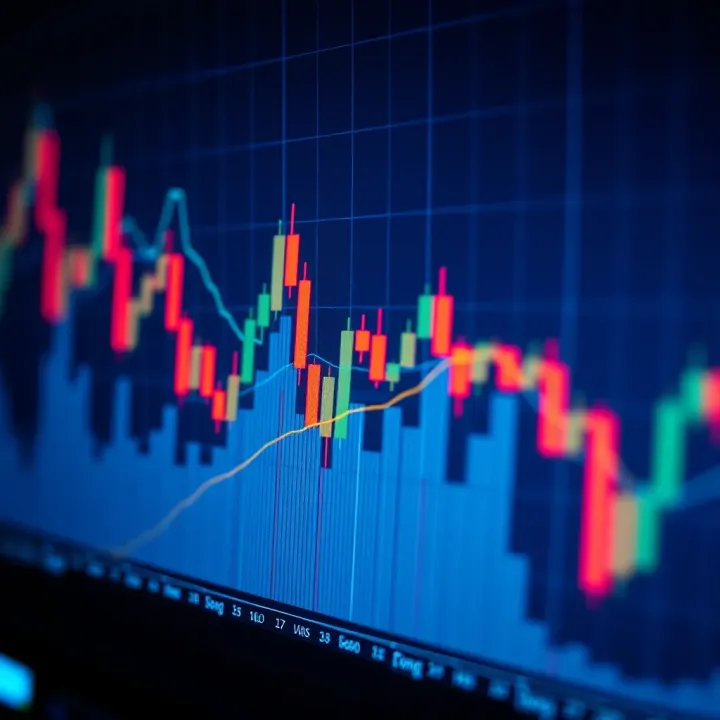
Candlestick patterns form the backbone of technical analysis in forex trading. These patterns represent price movements within a given time frame, offering clear visual cues about market sentiment and potential price direction. Unlike simple line charts, candlestick charts show the open, high, low, and close price for each period, making it easier to spot turning points or continuation of trends.
Understanding how to read candlesticks is vital because they reflect the tug of war between buyers and sellers. For instance, a long-bodied candle with a close near its high suggests strong buying interest, whereas one closing near its low highlights selling pressure. Such cues help traders anticipate whether the market might rise, fall, or stall.
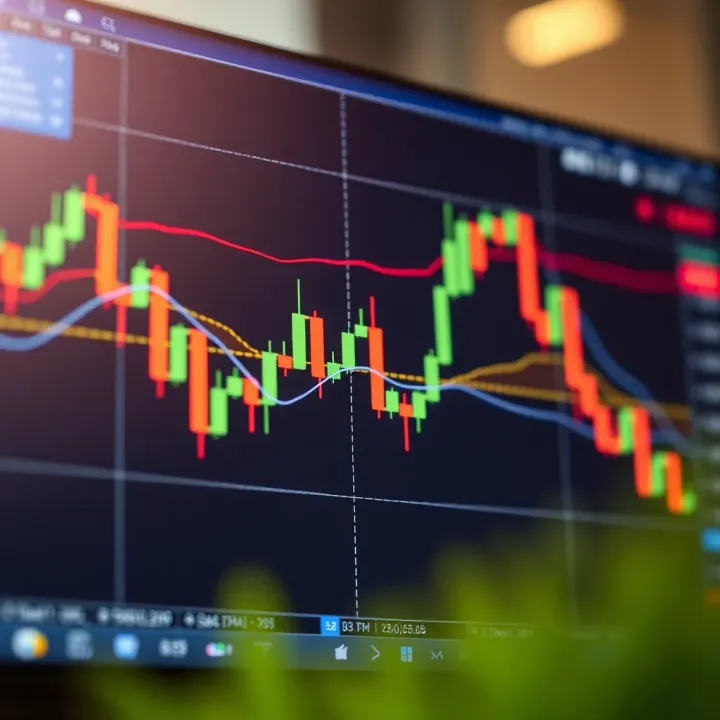
Candlestick patterns often reveal subtle shifts in market psychology that other chart types can miss, making them indispensable for forex traders aiming to make timely decisions.
Body: The rectangular section showing the difference between opening and closing prices.
Wicks (Shadows): Thin lines extending above and below the body indicating the highest and lowest prices during the period.
Colour: Typically green or white means the price closed higher, red or black means it closed lower.
Doji: When open and close prices are nearly equal, signalling market indecision.
Hammer and Hanging Man: Single-candle patterns that suggest potential reversals after a trend.
Engulfing Patterns: Where a larger candle fully covers the previous one, often marking strong shifts in momentum.
Using candlestick patterns alongside volume and support-resistance levels increases accuracy. For example, spotting an engulfing bullish candle near a key support zone might indicate a buying opportunity. On the other hand, relying solely on these patterns without context can mislead, especially during low liquidity periods often seen in off-market hours.
Recognising these signals improves your timing for entering or exiting trades and helps manage risk better. While mastering candlestick patterns takes practice, they are a practical tool that every forex trader should add to their strategy to read market movements more effectively.
Candlestick patterns form the backbone of technical analysis for forex traders looking to understand market sentiment quickly and accurately. They provide visual insight into price action across a given timeframe, making it easier to spot potential moves and reversals. In the fast-paced forex market, where currency pairs can swing in minutes, recognising these patterns offers traders a practical tool to time entry and exit points better.
At its core, each candlestick represents four key prices during a specific trading period: the opening price, closing price, highest price, and lowest price. The main body of the candlestick shows the range between the open and close. If the close exceeds the open, the candle is typically bullish (often coloured green or white). Conversely, if the close is below the open, the candle is bearish (red or black). The lines extending from the body — called the wicks or shadows — depict the highest and lowest prices reached. For example, if EUR/USD opens at 1.1200, hits a high of 1.1250, a low of 1.1180, and closes at 1.1230 during one hour, this entire price movement translates into one candlestick.
Candlestick charts differ from bar charts mainly in their visual clarity. While bar charts offer similar price data points, candlesticks emphasise the relationship between open and close, making it easier to spot bullish or bearish pressure at a glance. This visual distinction helps traders gauge momentum without sifting through complex data, especially in volatile conditions like those during major economic announcements.
Beyond mere numbers, candlesticks reveal the market's psychology. A long bullish candle signals strong buying interest, while a long wick suggests rejection of higher or lower prices. For example, a hammer shape indicates buyers stepping in after sellers pushed prices down initially, hinting at potential reversal. Such details provide clues about trader behaviour and sentiment, which can influence future price direction.
Candlestick patterns are especially useful for identifying trend reversals and continuations—critical moments for forex traders to make informed decisions. A pattern like a bullish engulfing candle following a downtrend often signals a possible turnaround, prompting traders to enter long positions. Conversely, a sequence of small-bodied candles might suggest indecision, requiring caution before committing capital.
Compared to other charting methods like line charts or simple bar charts, candlesticks pack more information in a single shape. This compactness improves decision speed. Traders can react quickly to patterns without waiting for multiple indicators to line up. In volatile forex markets, this agility can be the difference between profit and loss.
However, interpreting patterns isn't always straightforward. A common challenge is mistaking false signals for genuine reversals, especially without confirming data from volume or momentum indicators. Also, similar patterns can look alike but have different implications based on the market context or timeframe. For instance, a doji in a trending market may signal hesitation, but the same doji during consolidation means something else. Developing the skill to read these nuances takes experience and careful study.
Traders must blend candlestick analysis with other tools to strengthen their strategies and avoid costly errors.
Overall, understanding candlestick patterns lays a solid foundation for forex trading, enabling you to interpret price action clearly and react with confidence.
Single candlestick patterns serve as quick indicators of potential market shifts in forex trading. Recognising these patterns can help traders respond promptly to reversal signals or confirm ongoing trends without waiting for multiple candles to form. Being able to spot these formations swiftly often provides an edge in timing entries and exits, which is critical in the fast-paced forex market.
A doji forms when the opening and closing prices are almost equal, creating a candle with a tiny or non-existent body. There are several types: the standard doji, which looks like a cross; the dragonfly doji, where the open and close are at the high end of the range; and the gravestone doji, where they are at the low end. Each type signals slightly different market conditions, but all share an underlying theme of indecision.
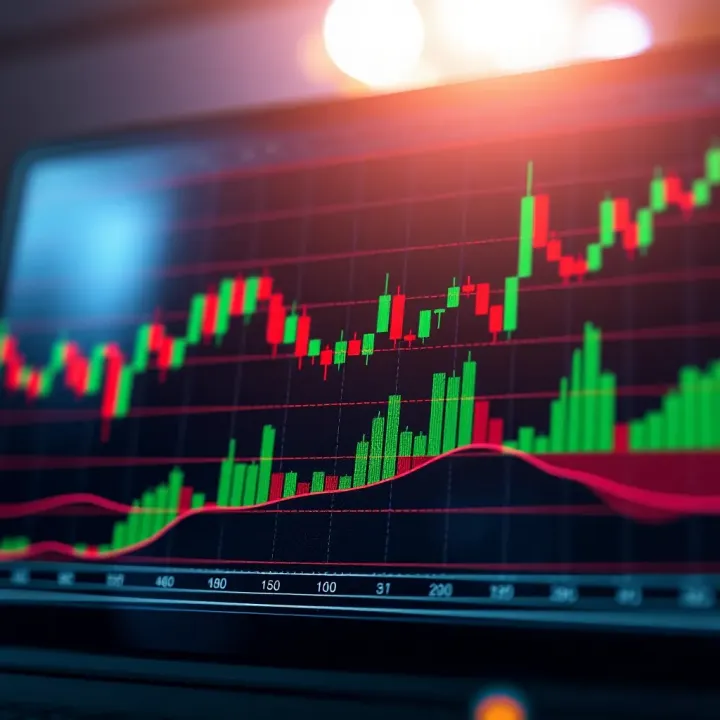
Doji patterns highlight moments of uncertainty among traders. When a doji appears after a strong uptrend, it indicates hesitation as buyers and sellers struggle to control the price. Similarly, following a downtrend, a doji suggests sellers are losing momentum. This indecision can precede a reversal or a pause in the current trend, making the doji a valuable flag for traders who keep a close eye on context and volume.
Trading strategies that use doji signals often wait for confirmation from the next candle or other indicators. For instance, after a doji forms at a support level, a bullish candle following it could signal a buy opportunity. On the other hand, if a bearish candle appears after a doji at resistance, traders might consider selling or tightening stops. Using dojis alone can be risky, so confirming the pattern with RSI or MACD readings helps reduce false signals.
Both hammer and hanging man candles have a small body near the top of the range and a long lower shadow, resembling a hammer shape. The key visual cue is that the lower wick must be at least twice the length of the body. This design shows that although sellers pushed the price down during the session, buyers managed to bring it back near the opening price by close.
Distinguishing between a hammer and a hanging man depends on the preceding trend. A hammer after a downtrend signals a possible bullish reversal, indicating buyers are gaining strength. Conversely, a hanging man after an uptrend warns of a bearish reversal, suggesting sellers may start to dominate. The colour of the body adds nuance: a green hammer or red hanging man strengthens the pattern’s implication.
For entry and exit points, traders typically use these patterns in conjunction with confirmation candles or volume spikes. Buying near the close of a hammer candle with a confirming bullish candle the next day can be effective. Similarly, seeing a hanging man followed by a bearish candle may prompt traders to exit long positions or initiate short trades. Stop-loss orders are often placed below the low of the hammer or hanging man to manage risk.
Single candlestick patterns like dojis, hammers, and hanging men offer fast insights, but interpreting them well requires attention to trend context and confirmation signals. Integrating these tools wisely helps traders make confident decisions in forex trading.
Multiple candlestick formations provide deeper insight into market trends than single candlestick patterns alone. They capture the interaction between buyers and sellers over consecutive periods, helping traders identify potential reversals or continuation signals with greater clarity. This is especially useful in the forex market, where quick reactions to shifting sentiment can make a big difference.
Engulfing patterns consist of two candles where the second candle completely ‘engulfs’ the body of the first. A bullish engulfing occurs when a small bearish candle is followed by a larger bullish candle, signalling that buyers have taken control from sellers. Conversely, a bearish engulfing pattern happens when a small bullish candle is followed by a larger bearish candle, indicating sellers are dominating.
These patterns often appear at market turning points. For example, after a downtrend, a bullish engulfing pattern may hint at a reversal to an uptrend. Traders consider this as a sign to enter buy positions. However, confirmation through other tools like volume or support levels is advisable to avoid false signals.
In the EUR/USD pair during March 2024, a bullish engulfing candle formed at a key support level near 1.05, immediately followed by upward price momentum. This clear engulfing signal helped traders capitalise on a strong upward move. Such real-world examples highlight the practical value of engulfing patterns when combined with proper analysis.
The Morning Star and Evening Star are three-candle patterns that signal trend reversals. A Morning Star forms at the bottom of a downtrend with a long bearish candle, a small indecisive candle (often a Doji or spinning top), and then a strong bullish candle. The Evening Star is the opposite, appearing at the top of an uptrend.
A Morning Star indicates a potential shift from selling to buying pressure, suggesting prices may rise. An Evening Star signals fading buying momentum and possible decline. These patterns tend to be more reliable than single candlestick signals due to the added confirmation from three bars.
Traders often wait for the completion of the third candle to confirm the reversal before entering a position. Entering too early could lead to whipsaws. Using additional confirmation like RSI divergence or support and resistance levels helps refine trade timing and reduce risk.
The Three White Soldiers pattern consists of three consecutive long bullish candles with small wicks, each opening within the previous candle’s body, indicating sustained buying strength. The Three Black Crows pattern features three successive bearish candles with similar traits, showing sustained selling pressure.
These formations often point to strong, confident trends. For example, Three White Soldiers suggest a powerful upward momentum that may last multiple sessions. However, such strength can lead to short-term overbought conditions needing caution.
Since these patterns reflect strong moves, they can sometimes mark the peak of trends before a pullback. Traders should combine them with indicators like the Relative Strength Index (RSI) or Fibonacci retracements to assess whether the trend is due for correction or likely to continue.
Multiple candlestick formations, when interpreted carefully with other tools, provide actionable signals that can improve your forex trading decisions and timing.
Candlestick patterns provide valuable clues about market sentiment but applying them effectively demands more than just recognition. Combining these patterns with other tools and sound risk management enhances your chance of identifying real trading opportunities while avoiding costly mistakes.
Using indicators like the Relative Strength Index (RSI), Moving Average Convergence Divergence (MACD), and moving averages alongside candlestick patterns helps confirm potential trade setups. For instance, spotting a bullish engulfing pattern when RSI is below 30 and MACD shows a bullish crossover strengthens the signal for a possible price reversal. Moving averages can help identify prevailing trends, so a candlestick pattern aligning with a moving average bounce holds more weight.
Avoiding false signals is essential since candlestick patterns alone can sometimes mislead. Technical indicators add a filter to weed out weaker signals. For example, a hammer candlestick during a downtrend may suggest a reversal, but if volume remains low and MACD stays bearish, the pattern’s reliability decreases. Traders should watch for mismatches between pattern signals and indicator trends to avoid jumping in prematurely.
Volume data also plays a crucial role in confirming candlestick signals. High trading volume during a pattern like a morning star often indicates stronger conviction among traders, supporting the likelihood of a reversal. Conversely, weak volume during a bullish pattern could mean the move lacks follow-through. In forex, where volume data is less transparent than stocks, watching liquidity changes during major market sessions can provide valuable hints.
Setting stop-loss orders based on candlestick pattern structure limits downside risk. For example, if you enter after a bullish engulfing candle, placing a stop-loss just below the pattern’s low protects your capital if the trade fails. This technique respects the natural support levels shown by the pattern itself.
Position sizing should align with your overall risk tolerance. Regardless of how convincing a pattern looks, risking too much on a single trade can quickly drain your account. Many traders risk only 1-2% of their capital per position, adjusting lots or contract sizes accordingly.
Avoid overreliance on single candlestick patterns by considering broader market context and other analysis tools. A pattern might signal a reversal, but without support from trendlines, fundamentals, or economic events, trading solely on it increases risk. Diverse confirmation leads to better decision-making and steadier results.
Using candlestick patterns effectively means blending them with other indicators and solid risk controls. This combined approach improves the odds of spotting real opportunities and managing losses in the fast-moving forex market.
Candlestick patterns offer valuable clues about market moves, but many traders stumble by misreading these signals or relying too heavily on them. Understanding common pitfalls can save you from costly errors and improve your overall trading strategy. So, it’s worth spending time on recognising and avoiding these mistakes.
Ignoring the larger market context often leads traders to false conclusions. For example, spotting a bullish engulfing pattern during a strong downtrend might tempt a trader to go long prematurely. But without considering the bigger picture—such as overall trend direction, key support or resistance levels, or prevailing economic conditions—the signal could be misleading. It’s similar to noticing a small ripple on a river and assuming the current has reversed, while the main flow remains steadfast. Always place candlestick patterns within the wider technical and fundamental context to confirm their reliability.
Confusing similar looking patterns is another frequent mistake. Certain candlesticks, like the hammer and hanging man, appear almost identical but have opposite implications depending on where they occur in the trend. Traders sometimes misinterpret a hanging man (which signals bearish reversal at the top of an uptrend) as a hammer (bullish reversal at a downtrend base), leading to poor entry or exit decisions. Paying attention to the pattern’s position on the chart and the preceding price action is crucial to distinguish these subtle differences.
Overtrading based on signals alone can decimate profits quickly. Seeing a dozen candlestick signals across multiple currency pairs might encourage a trader to jump into several trades without proper analysis or risk management. This approach increases exposure and emotional stress. Instead, patience pays—select only high-confidence trades confirmed by other indicators or fundamental cues, and avoid chasing every signal in the hope of quick gains.
Importance of combining with fundamental analysis cannot be overstated. Candlesticks reflect price action but don’t explain why prices move. For instance, a strong bullish pattern on USD/INR might be reversed immediately if RBI announces unexpected policy changes. Integrating economic data, central bank signals, and geopolitical events with candlestick analysis gives a broader, more accurate trading perspective.
Limitations in volatile or low liquidity markets affect the pattern’s validity. During major economic announcements or in thinly traded currency pairs, price movements can be erratic, producing false candlestick formations. For example, an apparent reversal pattern during a razor-thin session might be just a spike caused by a few large orders. Recognising market conditions and avoiding trading purely on candlestick signals in such periods is wise.
Adapting strategies to different currency pairs also matters. Some pairs, like EUR/USD or USD/JPY, are more liquid and follow technical signals well, but others with lower volumes or influenced by local markets may behave unpredictably. A candlestick pattern that works reliably on GBP/USD might fail on USD/INR due to differing market drivers. Tailoring your approach for each pair and testing patterns over historical data specific to that currency combination helps improve success rates.
Traders who avoid these common errors—context neglect, pattern confusion, overtrading, ignoring fundamentals, and mismatched strategies—build a stronger grasp on forex candlestick trading, leading to better decision-making and results.
By learning to spot where candlestick patterns can lead you astray and combining them with other methods, you can improve your trading accuracy and protect your capital. Always step back, analyse fully, and trade carefully rather than rushing in at every sign.
📈 Learn key candlestick patterns with real examples to read price movements effectively. Improve your trading decisions using this practical guide designed for Indian traders.
📊 Discover key bullish, bearish, reversal & continuation candlestick patterns to read market trends and boost your trading success effectively! 🔥
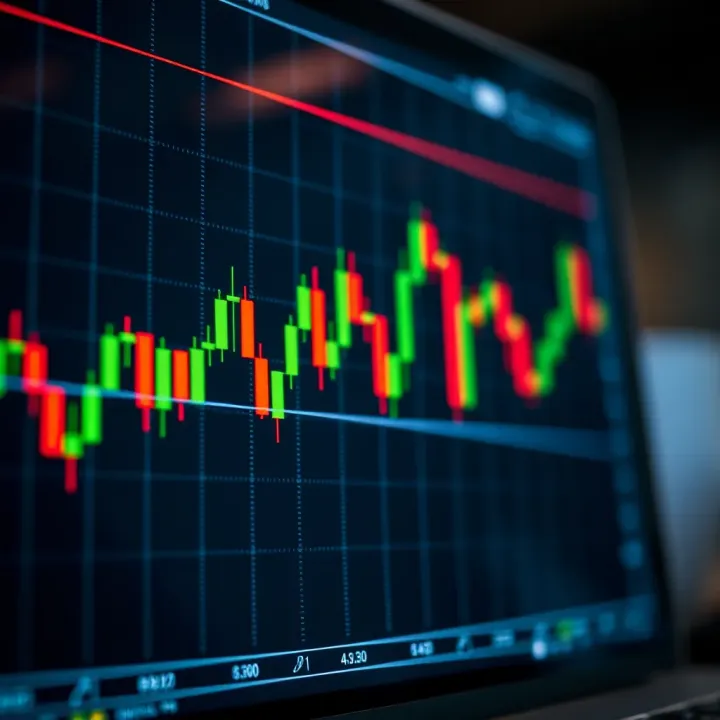
📈 Learn how to read market candlestick patterns for better trading decisions in the Indian financial markets. Get clear insights and practical tips for success!

📈 Explore key bullish single candlestick patterns to spot price rise signals in Indian markets. Learn how to read charts & improve your trading strategy effectively.
Based on 14 reviews