

Understanding Intraday Trading Basics
📊 Intraday trading explained: Learn key strategies, risks, and tools for same-day stock buying and selling. Practical insights for Indian investors.
Edited By
Henry Fletcher
Candlestick patterns are essential tools for traders focusing on intraday markets, where swift decisions can make the difference between profit and loss. These patterns illustrate price movements within a specific timeframe, typically a minute or hour for intraday trading, helping traders anticipate future price action.
Understanding the visual cues in candle charts gives you an edge in spotting trend reversals, continuations, and potential breakouts. For example, a Doji candle — where opening and closing prices are nearly equal — indicates market indecision, signalling a possible trend change. Traders often use it combined with volume data to decide whether to enter or exit.

Another useful pattern is the Hammer (or its inverse, the Hanging Man). When a Hammer forms after a downtrend, it suggests buyers are stepping in, hinting at a potential upward movement. Conversely, a Hanging Man after an uptrend may show selling pressure, calling for caution.
Recognising these patterns fast helps you spot entry and exit points more precisely. Also, combining candlestick analysis with support and resistance levels or indicators like Moving Averages strengthens trading signals.
Successful intraday trading depends on correctly reading market sentiment. Candlestick patterns act as a simple yet powerful language revealing this sentiment within minutes.
Here are a few practical tips for applying candle patterns in intraday trading:
Observe volume alongside the pattern; a genuine signal usually comes with increased volume.
Avoid relying on a single candle. Look for confirmation from the next candle or other indicators.
Tailor your strategy to the asset’s volatility; what works for Nifty might differ for a mid-cap stock.
In the fast-paced environment of intraday trading, mastering these candle patterns can refine your timing and risk management, ultimately boosting your chances of consistent profits.
Intraday trading revolves around rapid decision-making based on price action within the trading day. Candlestick patterns provide a visual summary of price movements, which helps traders read market sentiment quickly. Recognising these patterns can give you an edge in spotting potential reversals or continuations, thus aiding well-timed entry and exit decisions.
A single candlestick captures four key price points: the opening, closing, highest, and lowest price during a specific time frame. The body of the candle shows the difference between opening and closing prices, while the wicks (or shadows) indicate the range covered. For instance, a long lower wick with a small body often signals buying pressure after a dip, which can hint at a potential price bounce within the day.
Unlike line charts or bar charts, candlesticks present a clearer, more intuitive view of price action. A line chart simply connects closing prices, missing intraday volatility, while bar charts display similar information but are less visually immediate. Candlestick charts combine price levels into a compact form, making it easier to spot patterns like hammers, engulfing candles, or dojis, which have distinct market implications.
One key reason these patterns matter is that they help capture market sentiment in real time. For example, a bullish engulfing pattern during late morning trading in the Nifty 50 often indicates increasing buyer strength, pushing prices higher. Capturing such sentiment quickly means you can make timely trades rather than waiting for late confirmations.
Short-term price movements hold particular significance for intraday traders due to their ability to show immediate supply-demand shifts. Minor changes within 5 to 15-minute candlestick charts can translate into profitable trading signals. This focus on short windows is essential because trends can reverse within hours, even minutes, so catching these subtle cues can prevent losses or secure gains.
Successful intraday traders use candlestick patterns not as standalone signals but in combination with volume and price action to read the market pulse faster.
By understanding candlestick basics and why they matter, you position yourself to react swiftly in the fast-moving market environment prevalent during daily trading sessions.
Recognising key candle patterns helps intraday traders make swift, informed decisions based on short-term price behaviour. These patterns reveal the battle between buyers and sellers, indicating potential reversals or continuations in price movement. By spotting such signals early, traders can pick better entry and exit points, minimise losses, and boost profit chances during the trading day.
The hammer pattern forms when a candle has a small body near the top with a long lower wick, signalling strong buying after initial selling pressure. It's particularly useful after a downtrend, hinting at a possible reversal as buyers gain control. The inverted hammer looks similar but has the long wick on top, suggesting early resistance that buyers might overcome soon. Both patterns are valuable because they highlight a shift in sentiment without waiting for confirmation from subsequent candles.
This pattern appears when a small bearish candle is followed by a large bullish candle that completely engulfs the previous one’s body. It indicates a strong shift in momentum to the upside. For intraday traders, a bullish engulfing signals a sudden surge in buying interest and often precedes upward price movement. Spotting this during intraday trading can warn you to consider opening long positions or tightening stop-loss levels on shorts.
The morning star is a three-candle pattern signalling the end of a downtrend and start of an uptrend. It starts with a long bearish candle, followed by a small-bodied candle that shows indecision, and finally a large bullish candle confirming reversal. For intraday moves, this pattern reflects a day's confidence shift, helping traders spot potential bounce backs early and plan trades accordingly.
A shooting star has a small body near the bottom and a long upper wick, showing that buyers tried to push the price up but sellers took charge by session close. This often appears after an uptrend and warns of a possible pullback. Intraday traders find this pattern helpful to exit longs or consider shorts, especially when reinforced by volume spikes or resistance levels.

This pattern mirrors the bullish engulfing but in the opposite direction—a large bearish candle fully covers the smaller previous bullish candle. It reflects strong selling pressure overcoming buyers. Intraday traders watch this for quick reversals or trend corrections and may reduce risk on long trades or enter short positions when confirmed.
The evening star is the bearish counterpart to the morning star, signalling trend reversal from bullish to bearish. It combines a long bullish candle, a neutral indecisive candle, and a strong bearish candle. This pattern helps intraday traders identify a shift in sentiment before significant downward moves occur, enabling timely decision-making.
A doji candle opens and closes at nearly the same price, showing indecision in the market. It signals that the forces of buying and selling are balanced, which could precede a reversal or continuation depending on context. For intraday traders, a doji near support or resistance levels is an alert to watch the next candles closely before committing.
Spinning top candles have small bodies with wicks on both sides, also highlighting market indecision but with slightly more trading range than a doji. They show that neither buyers nor sellers had full control during the trading period. Spotting spinning tops amid trend exhaustion can hint at possible pauses or reversals, helping traders adjust their strategies swiftly.
Remember: While these patterns provide valuable clues, always combine them with volume and other technical tools for better accuracy in intraday trading. Patterns alone can be tricky in fast-moving markets.
By mastering these key candle patterns, you refine your ability to read short-term price action and improve your trade timing in intraday markets.
Applying candlestick patterns effectively in intraday trading requires more than just recognising shapes on a chart. Traders need to confirm these signals with other market data to avoid false alarms and optimise entry and exit points. This approach minimises risks and maximises potential profits during the hectic trading day.
Volume plays a key role in validating candlestick patterns. For example, a bullish engulfing pattern accompanied by high volume suggests strong buying interest, making the signal more reliable. On the other hand, the same pattern with low volume could be a false indication, as less market participation dampens its significance. Intraday traders often watch volume spikes to confirm breakouts or reversals indicated by candle formations.
Volume is particularly useful in volatile markets like India’s, where sudden price moves can be misleading without volume support. A quick surge in volume during an upward candle pattern signals genuine demand, helping traders make better decisions before price reverses.
Relative Strength Index (RSI) and moving averages provide additional layers of confirmation. An overbought RSI reading near 70 paired with a bearish candlestick pattern such as a shooting star can warn traders of an impending pullback. Similarly, a bullish pattern forming near or above a short-term moving average like the 20-period MA often signals a stronger uptrend.
Moving averages also help filter out noise by smoothing price action. When a bullish candlestick forms as the price crosses above the moving average with rising RSI, it gives a clearer signal to enter a trade. Combining these indicators reduces chances of being caught in sideways movements or fake breakouts.
Knowing when to enter a trade based on candle patterns is vital in intraday trading. A common strategy is to wait for confirmation candle closing. For instance, after spotting a hammer pattern at a support level, traders often wait for the next candle to close higher before entering a long position. This avoids jumping in too early during market indecision.
Additionally, intraday traders may combine pattern recognition with price action around key levels like opening range or pivot points. Entry signals that align with these zones tend to have higher success, allowing the trader to catch moves while momentum is building.
Proper risk management hinges on setting stop-loss and profit targets immediately after entry. A practical method is to place stop-loss just below the low of a bullish reversal candle or above the high of a bearish pattern. This keeps risk limited to a defined level while respecting the pattern’s structure.
For profit targets, intraday traders often use nearby resistance or support levels, Fibonacci retracements, or predefined risk-reward ratios, commonly 1:2 or higher. For example, if risking ₹1,000 on a trade, targeting at least ₹2,000 profit balances potential reward against risk, ensuring sustainable trading over time.
Using candle patterns effectively means combining them with volume, momentum indicators, and disciplined trade management to improve the odds of success in intraday trading.
This methodical approach helps traders navigate India’s fast-moving markets where rash decisions can lead to losses. Instead, it promotes confident trading with clear entry and exit points shaped by multiple confirming signals.
Mistakes often occur when traders rely solely on candlestick patterns without considering the broader market context. Understanding common pitfalls helps intraday traders avoid losses and improve strategy effectiveness. This section explores frequent errors like false signals and risk mismanagement, offering practical ways to navigate these challenges.
Ignoring the general market trend often leads to false signals. For instance, spotting a bullish hammer in a downtrend may tempt a trader to buy, only for the price to keep falling. The market’s bigger momentum usually overpowers single candle signals, so it’s essential to check the trend before making decisions. If the Sensex or Nifty is firmly bearish, bullish candles alone rarely indicate a strong reversal.
A practical approach is to combine candlestick patterns with trend analysis tools like moving averages. If the 15-minute chart shows an uptrend and a bullish engulfing pattern appears near support, it’s a better buy signal than if the pattern forms amid a downtrend. By respecting the trend, traders can reduce the risk of falling for fake reversals.
Focusing too much on one candle can mislead you, especially in fast-moving intraday markets. Candlestick patterns work best when confirmed by subsequent price action or other indicators. For example, a doji candle may signal indecision, but without follow-up movement, it tells little about direction.
Relying on single candles can also cause premature trades. Instead, look for sequence patterns or support and resistance confluence. For example, after a bullish engulfing candle, wait for a close above the high before entering. This method helps confirm the validity of the candle’s signal and avoids whipsaws.
A sound risk-reward ratio protects your capital while allowing profit potential. Typically, intraday traders aim for at least a 1:2 risk-reward ratio, meaning the potential gain should be twice the risked loss. This ratio ensures that even if only half your trades win, you can still come out ahead.
For example, if you place a stop-loss at ₹50 below your entry price, your target should be at least ₹100 above. Ignoring this can lead to small gains frequently wiped out by a few losses. Consistently applying a healthy risk-reward ratio keeps your trading sustainable.
Proper position sizing reduces the chance of heavy losses from any single trade. Your position size depends on the capital you’re willing to risk per trade and the distance between your entry and stop-loss points.
For instance, if you risk 1% of your ₹2 lakh capital (₹2,000) and your stop-loss is ₹20 away from the entry price, you buy shares worth ₹40,000 (₹2,000 ÷ ₹20 = 100 shares at ₹400 each). This calculated position sizing helps you control losses and maintain discipline, which is vital when the market suddenly swings against your trade.
Managing false signals and risks carefully marks the difference between a consistent intraday trader and a lucky one. By combining candle patterns with broader market context and disciplined risk management, your trades stand a better chance of success.
Using candle patterns effectively in intraday trading involves more than simply recognising shapes on a chart. Practical tips can help you interpret these patterns within the broader market context and improve your trading decisions. When combined with real-time market dynamics, understanding candle patterns becomes a sharper tool for spotting entry and exit points while managing risks efficiently.
Market-moving news, such as quarterly results, RBI announcements, or geopolitical developments, can dramatically affect intraday price action. A bullish hammer pattern during quiet hours may quickly turn irrelevant once unexpected news breaks. For example, if a stock forms a bullish engulfing candle but corporate guidance is downgraded the same day, the pattern’s reliability drops. Staying aware of current events helps prevent misreading candles influenced by sudden external shifts rather than trader sentiment.
Traders should therefore complement candle analysis with a simple news check before committing capital. Apps and websites offering live updates enable you to spot when patterns may lose their edge due to fresh information. Ignoring such context can lead to false signals and losses.
Candle patterns gain strength when they appear near critical support or resistance levels. Suppose a bullish morning star forms just above a well-established support zone. In that case, it signals a higher chance of price reversal with confirmation from price-level significance. On the other side, spotting a shooting star near a strong resistance adds weight to a potential short sell.
Recognising these zones on intraday charts, such as 15-minute or 30-minute frames, helps you filter out patterns that occur in unlikely price regions. This focus improves accuracy since candles near relevant levels better represent market participants' real intention.
Demo accounts offer a risk-free environment to apply candle pattern strategies. You can try spotting and trading patterns like spinning tops or dojis without risking actual money. For instance, practising trades around earnings announcements or volatile sessions teaches you how reactive candle formations behave under different conditions.
By repeatedly executing paper trades, you sharpen your pattern recognition and decision timing. It's like a pilot training on simulators—experience before hitting the real market.
Consistency matters when adopting candle patterns. Keeping a trading journal or digital record of your trades based on specific candles helps assess which patterns work well in your chosen stocks or sectors. For example, you might find bullish engulfing patterns yield better returns in banking stocks during particular hours.
Analysing this data enables refining your approach. Over weeks or months, you notice trends such as reliable patterns in trending markets or those prone to failure during sideways movements. This empirical lens avoids blind faith and steers you toward systematised intraday trading.
Successful intraday trading with candle patterns blends sharp observation, timely context checks, and disciplined practice. This practical approach reduces mistakes and increases your chance of consistent profits.
📊 Intraday trading explained: Learn key strategies, risks, and tools for same-day stock buying and selling. Practical insights for Indian investors.
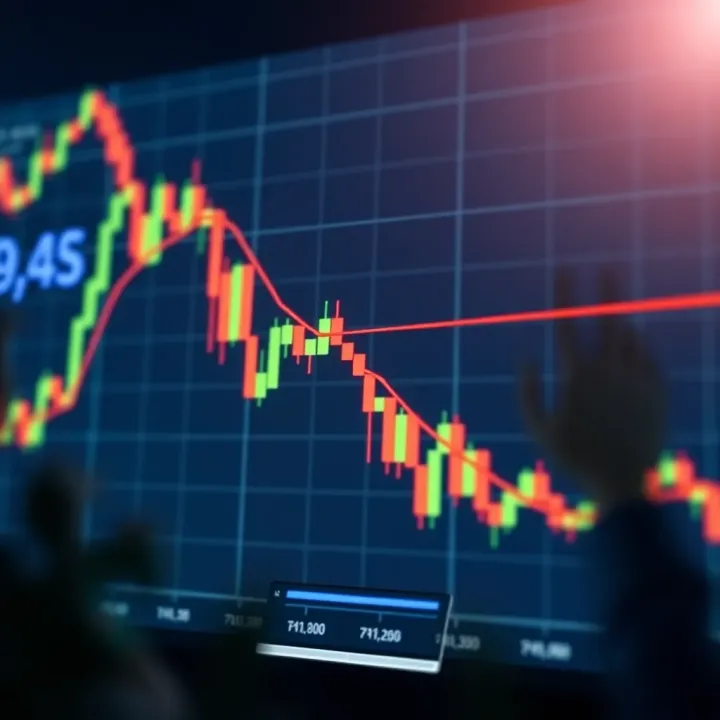
Discover the most profitable chart patterns 📈 used by traders to spot key price moves. Learn to recognize & apply them in stocks & forex markets with expert tips.
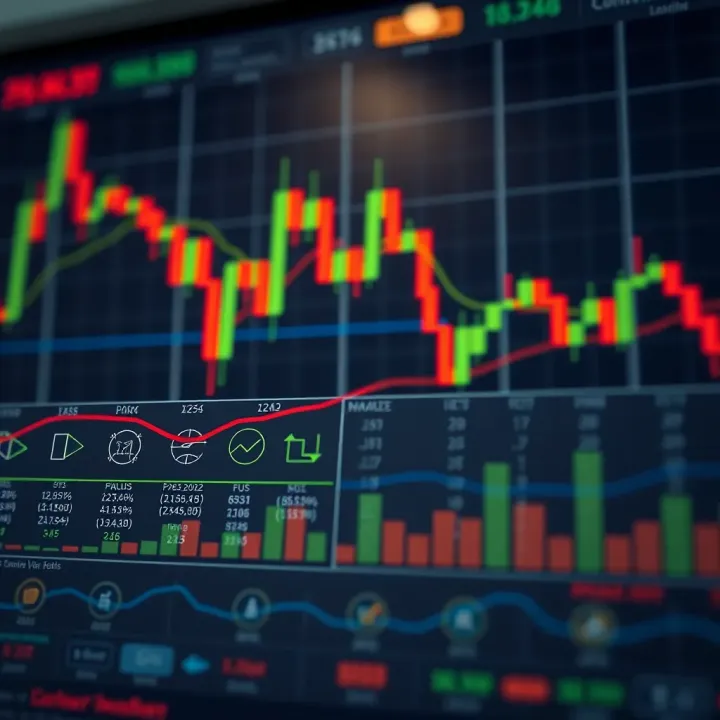
📊 Discover key bullish, bearish, reversal & continuation candlestick patterns to read market trends and boost your trading success effectively! 🔥

📈 Learn intraday trading basics in India with expert tips on market timings, risk management, and technical analysis. Start smart, avoid common mistakes! 💡
Based on 11 reviews